How To Visualize Relationships
Relationships are an integral part of life, and understanding how to visualize them can be a powerful tool for businesses, marketers, researchers, and more. Visualizing relationships can help you better understand the dynamics of your business, customers, and products, and can help you make better decisions. In this article, we’ll explore how to visualize relationships and the benefits of doing so.
What is Relationship Visualization?
Relationship visualization is a way of representing relationships between entities. This can be done in a variety of ways, including diagrams, charts, and graphs. The purpose of relationship visualization is to make it easier to understand the connections between different entities, and to identify patterns and trends in the data. By visualizing relationships, you can gain insights into how different entities are related and how they interact with each other.
Benefits of Visualizing Relationships
Visualizing relationships can provide a number of benefits. It can help you better understand the dynamics of your business, customers, and products. It can also help you identify patterns and trends in the data, which can help you make better decisions. Additionally, visualizing relationships can help you identify potential opportunities and risks, and can help you develop strategies to capitalize on those opportunities or mitigate those risks.
Types of Relationship Visualization
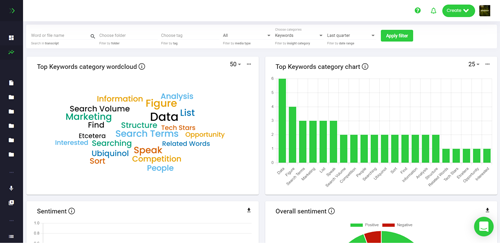
There are a variety of ways to visualize relationships. The most common types of relationship visualization are diagrams, charts, and graphs. Diagrams are useful for showing the relationships between entities, and can be used to illustrate the flow of information or the structure of a system. Charts and graphs are useful for displaying numerical data, and can be used to show trends and correlations. Additionally, there are a number of software tools available that can help you create visualizations of relationships.
How to Create Relationship Visualizations
Creating relationship visualizations can be a complex process, but there are a few steps you can take to make the process easier. First, you need to identify the entities you want to visualize and the relationships between them. Next, you need to decide which type of visualization is best suited to your data. Finally, you need to create the visualization using the appropriate software or tools. Once you’ve created the visualization, you can use it to gain insights into the relationships between the entities.
Tips for Creating Effective Relationship Visualizations
Creating effective relationship visualizations requires careful consideration. Here are a few tips to help you create effective visualizations:
- Focus on the most important relationships. Don’t try to visualize every single relationship; focus on the most important ones.
- Choose the right type of visualization. Different types of visualizations are better suited to different types of data. Make sure you choose the right type of visualization for your data.
- Make sure the visualization is easy to understand. Your visualization should be easy to understand and interpret. If it’s too complex, it won’t be useful.
- Keep it simple. Don’t try to cram too much information into your visualization. Keep it simple and focused.
Conclusion
Visualizing relationships can be a powerful tool for businesses, marketers, researchers, and more. It can help you better understand the dynamics of your business, customers, and products, and can help you make better decisions. There are a variety of ways to visualize relationships, and there are a number of software tools available to help you create visualizations. By following the tips outlined in this article, you can create effective relationship visualizations that will help you gain insights into the relationships between entities.


