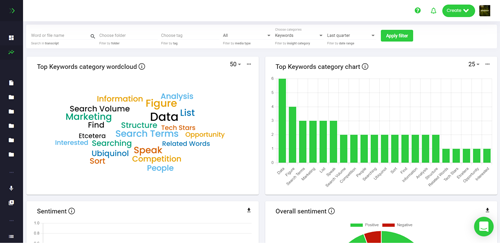
How To Visualize JSON Data
JSON (JavaScript Object Notation) is a lightweight data-interchange format that is used to store and exchange data between different systems. It is easy to read and write, and is often used in web development and data science applications. Visualizing JSON data can be a challenge, but it is an important skill to have for anyone working with data. In this article, we'll discuss some of the best ways to visualize JSON data and provide tips on how to make the most out of your visualizations.
What is JSON?
JSON is a lightweight data-interchange format that is used to store and exchange data between different systems. It is easy to read and write, and is often used in web development and data science applications. JSON is based on the JavaScript programming language, and it is a subset of the JavaScript object notation. JSON is composed of two main elements: objects and arrays. Objects are collections of key-value pairs, and arrays are ordered lists of values.
Why Visualize JSON Data?
Visualizing data is an important part of data analysis. It helps to make sense of large amounts of data and can be used to identify patterns and trends. Visualizing data can also help to identify outliers and anomalies, which can be useful for debugging and troubleshooting. Visualizing data can also help to communicate complex information in a more understandable way.
Tips for Visualizing JSON Data
1. Choose the Right Visualization
The first step in visualizing JSON data is to choose the right visualization. Different types of data require different types of visualizations. For example, bar charts are best for comparing values, while line graphs are best for tracking trends over time. It is important to choose the right visualization for the data you are working with.
2. Use Color to Your Advantage
Color can be used to draw attention to important elements in a visualization. For example, you can use color to highlight outliers or to emphasize trends. Color can also be used to group related elements together, making it easier to understand the data.
3. Make Use of Annotations
Annotations are a great way to add context to a visualization. Annotations can be used to explain the meaning of a visualization or to point out important elements. Annotations can also be used to add additional information to a visualization, such as the source of the data or the date the data was collected.
4. Use Interactivity
Interactive visualizations are a great way to explore data in more depth. Interactive visualizations allow users to drill down into the data and explore it in more detail. Interactive visualizations can also be used to compare different datasets or to explore correlations between different variables.
5. Keep It Simple
It is important to keep visualizations as simple as possible. Too much detail can make it difficult to understand the data, and can lead to confusion. It is better to focus on the most important elements of the data and leave out any unnecessary details.
Conclusion
Visualizing JSON data can be a challenge, but it is an important skill to have for anyone working with data. By following the tips outlined in this article, you can make the most of your visualizations and make sense of large amounts of data. With the right visualization, you can identify patterns and trends, highlight outliers and anomalies, and communicate complex information in a more understandable way.


