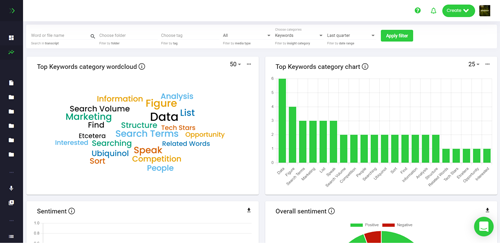
How To Visualize Google Trends
Google Trends is a powerful tool that can help you gain insights into the search behavior of your target audience. It can help you understand what topics are trending, and how your content is performing in comparison to your competitors. But how can you visualize the data from Google Trends? In this article, we’ll discuss how to use Google Trends to create beautiful visualizations that can help you better understand your target audience.
What is Google Trends?
Google Trends is a free tool provided by Google that allows you to explore how often certain topics and keywords are searched on Google. It also provides insights into the geographical distribution of search queries, as well as the relative popularity of different topics over time.
Why Visualize Google Trends?
Visualizing Google Trends data can be a great way to gain insights into the search behavior of your target audience. By creating visualizations, you can quickly and easily identify trends and patterns in the data that may not be immediately obvious. This can help you better understand your target audience and make more informed decisions about your content strategy.
How to Visualize Google Trends
There are several ways to visualize Google Trends data. Here are a few of the most popular methods:
1. Line Graphs
Line graphs are a great way to visualize the relative popularity of different topics over time. To create a line graph, simply enter the topics you want to compare in the Google Trends search bar, select the “Line Graph” option, and click “Search”. The graph will then display the relative popularity of each topic over time.
2. Maps
Maps are a great way to visualize the geographical distribution of search queries. To create a map, simply enter the topic you want to explore in the Google Trends search bar, select the “Map” option, and click “Search”. The map will then display the geographical distribution of search queries for that topic.
3. Bar Graphs
Bar graphs are a great way to compare the relative popularity of different topics. To create a bar graph, simply enter the topics you want to compare in the Google Trends search bar, select the “Bar Graph” option, and click “Search”. The graph will then display the relative popularity of each topic.
4. Scatter Plots
Scatter plots are a great way to visualize the relationship between two topics. To create a scatter plot, simply enter the two topics you want to compare in the Google Trends search bar, select the “Scatter Plot” option, and click “Search”. The graph will then display the relationship between the two topics.
Conclusion
Google Trends is a powerful tool that can help you gain insights into the search behavior of your target audience. By visualizing the data from Google Trends, you can quickly and easily identify trends and patterns in the data that may not be immediately obvious. This can help you better understand your target audience and make more informed decisions about your content strategy.


