How to Do Thematic Analysis in Excel
Doing thematic analysis in Excel is a great way to quickly and efficiently summarize data and gain insights into a data set. Thematic analysis is a method of analyzing qualitative data, such as interviews or open-ended survey questions, to identify patterns and themes in the data. It can help you to quickly identify trends and make decisions.
Step 1: Gather Your Data
Before you can do thematic analysis in Excel, you need to gather your data. This data can be from interviews, surveys, or any other qualitative source.
Step 2: Analyze the Data
Once you have your data together, it’s time to start your thematic analysis. The first step is to look for patterns in the data. This can be done by reading through the data and noting any commonalities. It can also be done by creating a coding scheme, which is essentially a way to classify and organize the data into categories.
Step 3: Create a Thematic Analysis Table in Excel
Once you have identified patterns in the data and created a coding scheme, you can create a thematic analysis table in Excel. To do this, you will need to create a new worksheet in Excel and enter the information from your coding scheme. This will create a table that you can use to analyze and visualize your data.
Step 4: Visualize the Themes and Patterns
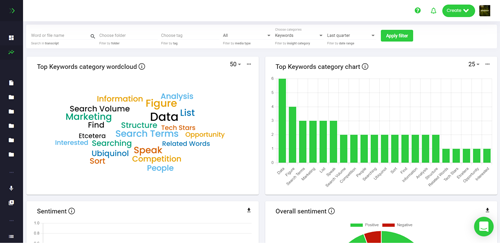
Once your thematic analysis table is set up in Excel, you can visualize the patterns and themes in your data. You can do this by creating graphs, charts, and other visualizations. This can help you to quickly and easily identify trends and draw conclusions from the data.
Step 5: Generate Insights From Your Data
Once you have identified the patterns and themes in your data, you can generate insights from the data. This can be done by looking for correlations between different themes or by looking for outliers in the data. By generating insights from your data, you can make better decisions and take action based on the data.
Conclusion
Thematic analysis in Excel is a great way to quickly and efficiently summarize data and gain insights into a data set. By following the steps outlined above, you can easily create a thematic analysis table and generate insights from your data.
References
- Thematic Analysis in Excel: A How-To Guide
- How to Do Thematic Analysis in Excel
- Thematic Analysis: How to Analyze Qualitative Data


