
Updates
What's New In Speak - April 2024
Interested in What's New In Speak February 2024? Check out this post for all the new updates available for you in Speak today!
Data visualization is a hot topic of discussion in technology and business. It is an industry constantly growing, with new jobs being created daily. The data visualization sector has huge growth potential, and companies are looking for talented individuals to fill these roles.
The demand for these positions has increased dramatically over the last few years because more people are using data visualizations than ever before. Between 2020 and 2027, analysts anticipate the global market for data visualization will expand at a compound yearly growth rate of 9.69%.
Many companies are now using them as part of their marketing strategies or their overall business plan. This means more opportunities are available for those who want to work in this field.
This blog post will discuss some of the best ways to make it big in data visualization in 2023.
We will also look at some of the most important occupations in the field of data visualization, their average salaries, and some of the daily tasks.
Data visualization refers to the presentation of data in a way that supports analysis and understanding. It is an important component of statistical graphics, frequently used to explore, explain and persuade. Visualization is applied to diverse fields such as information design, computer science, cartography, epidemiology, decision making and business intelligence.
Data visualization is a technique for turning data into information, knowledge and insights. The best data visualizations tell a story, create an emotional connection and reveal something that wasn't obvious. Data visualizations can be beautiful artworks or informative tools to help you make more informed decisions. They are also useful in helping people understand complex systems or datasets that contain many variables.
Data visualization is not just about pretty pictures but about creating effective communication tools that allow us to see patterns and trends that would otherwise go unnoticed in raw numbers or tables of numbers.
Data visualization can be used to:
Data visualization is a hot career path that can take you to the top of your field. The demand for data scientists and other data visualization jobs is growing and is expected to continue rising in the coming years.
Data visualization jobs are so popular because they can immediately impact a company's bottom line. It's easy to see how a well-designed data visualization could help a business make better decisions about its products, services and marketing efforts — which makes it a great choice for those looking for careers that give them an immediate return on their investment.
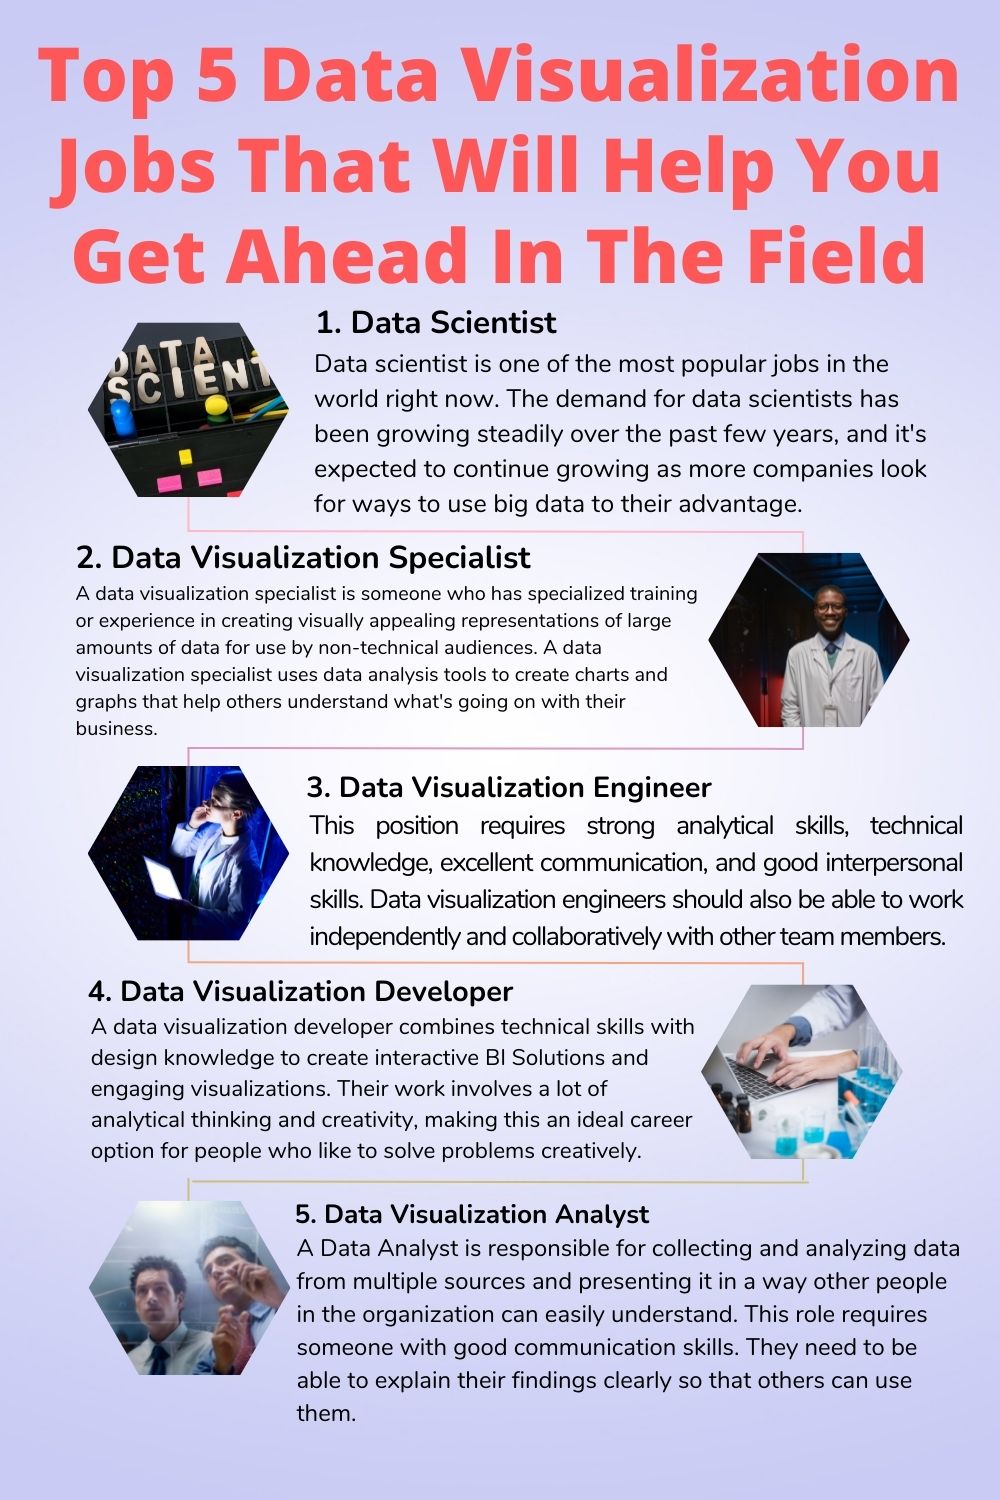
Here are five data visualization jobs that will help you get ahead in the field:
Data scientist is one of the most popular jobs in the world right now. The demand for data scientists has been growing steadily over the past few years, and it's expected to continue growing as more companies look for ways to use big data to their advantage. Data scientists use statistics, machine learning and other analytical methods to uncover insights from large datasets. They are responsible for creating new algorithms that machines can use to make decisions and solve problems faster than humans could ever do manually.
The growth rate for this occupation is 36 percent, which is much higher than the average growth rate for all occupations. You can expect an annual median salary of $100,910.
A data visualization specialist is someone who has specialized training or experience in creating visually appealing representations of large amounts of data for use by non-technical audiences. A data visualization specialist uses data analysis tools to create charts and graphs that help others understand what's going on with their business. This can include simple line graphs and pie charts to more advanced visualizations like treemaps and heat maps.
These specialists can work on teams with other analysts or developers on projects requiring visualizations for their clients or customers. They may also take on leadership roles within their companies, helping to create new ways for their organizations to analyze and present their data.
The average annual compensation for a data visualization expert is $60,160, with an expected range of $40,000 to $90,000.
This position requires strong analytical skills, technical knowledge, excellent communication, and good interpersonal skills. Data visualization engineers should also be able to work independently and collaboratively with other team members. They may be tasked with creating interactive dashboards or reports using tools such as Tableau or Looker using R or Python language libraries.

Data visualization engineers can expect to earn an average salary of $72,323 per year, ranging from $51,000 to $110,000 per year.
A developer must have strong analytical and excellent technical skills to build powerful interactive dashboards and other applications that non-technical users can use.
A data visualization developer combines technical skills with design knowledge to create interactive BI Solutions and engaging visualizations. Their work involves a lot of analytical thinking and creativity, making this an ideal career option for people who like to solve problems creatively. In addition, communicating effectively with non-technical users is critical for this job role because they will need to be able to explain how their designs work and why they made certain design decisions.
The annual salary of a data visualization developer can range from $50,000 to $120,000, with the median salary sitting at $77,000.
A Data Analyst is responsible for collecting and analyzing data from multiple sources and presenting it in a way other people in the organization can easily understand. This role requires someone with good communication skills. They need to be able to explain their findings clearly so that others can use them. Data Analysts also need strong analytical skills to look at data objectively and solve problems logically.

They are responsible for discovering and collecting high-quality data for solving problems and making strategic recommendations via experimentation or exploratory analysis. They perform tasks such as identifying the best data hygiene practices and integrating and transforming data from multiple sources.
The average data visualization analyst's salary is $69,035, ranging from $49,000 to $95,000 per year.
The skills and qualifications you need for data visualization jobs will depend on the role you’re applying for. However, there are some core skills that are common to all data visualization roles:
Most roles will require some knowledge of coding languages, such as HTML, CSS, JavaScript, or Python.
You need to be able to analyze data and draw insights from it.
You need to be able to design visuals that are aesthetically pleasing and easy to understand.
You need to be able to communicate complex information in an understandable way.
You need to be able to understand business objectives and be able to apply data visualization to meet these objectives.
The salary you can expect to earn for data visualization jobs will vary depending on the role you’re applying for, your experience, and the company you’re working for. However, according to Glassdoor, the average salary for a data visualization specialist is $81,000 per year.
Data visualization can be a rewarding and interesting career, but like all jobs, there are both advantages and disadvantages. Here are some of the pros and cons of working in data visualization:
• You can make complex data easier to understand and draw insights from it.
• You get to use your creativity and problem-solving skills.
• You can work in a variety of different fields and industries.
• You can work remotely or in an office.
• The job can be time-consuming and require a lot of focus.
• You need to stay up to date with new technology and trends.
• You need to be able to communicate complex information in an understandable way.
• You may need to work long hours to complete projects.
If you’re looking for a data visualization job, you should start by making a list of the skills and qualifications you need for the role and then look for job postings that match your criteria. You should also look for companies that are looking for data visualization specialists, as these companies are likely to be the best fit for you.
You can also network with other data visualization professionals and attend events or conferences to meet potential employers. This will also help you stay up to date with the latest developments in the field and may help you find the right job for you.
Data visualization is becoming increasingly important in the marketing world and there are now a great variety of data visualization jobs available. These roles require a range of skills and qualifications, and the salary you can expect to earn will depend on the role you’re applying for.
If you’re looking for a data visualization job, you should start by making a list of the skills and qualifications you need for the role and then look for job postings that match your criteria. You should also look for companies that are looking for data visualization specialists, as these companies are likely to be the best fit for you.
Good luck with your search and we hope you find the right data visualization job for you.
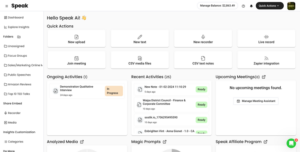
If you want to be a data visualization specialist in 2023, starting now is important. You need to learn how to use the tools and techniques like Speak Ai that will be most effective in your career.
This tool allows users to easily create interactive visualizations. It helps them share their findings with others more effectively than ever before.
Therefore, you must join 8,000+ individuals and teams relying on Speak Ai to create dependable data visuals for their companies.
Start your trial or book a demo to automatically visualize language data, unlock easier ways to earn revenue and keep doing what you love.

Interested in What's New In Speak February 2024? Check out this post for all the new updates available for you in Speak today!
Interested in What's New In Speak February 2024? Check out this post for all the new updates available for you in Speak today!
Interested in What's New In Speak February 2024? Check out this post for all the new updates available for you in Speak today!

Thank you for continuing to be part of this journey - it means the world to us. Below is a summary of our 2023 at
Interested in The Best Executive Research Firms? Check out the dedicated article the Speak Ai team put together on The Best Executive Research Firms to learn more.
Interested in The Best Consumer Research Firms? Check out the dedicated article the Speak Ai team put together on The Best Consumer Research Firms to learn more.
Powered by Speak Ai Inc. Made in Canada with 