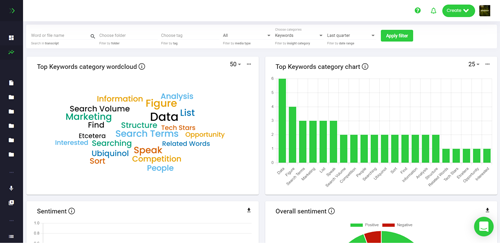
How To Visualize Microsoft Excel Data
Microsoft Excel is one of the most powerful and versatile data analysis tools available. It can be used to store, manipulate, and visualize data in a variety of ways. Visualizing data can help you better understand trends, patterns, and relationships in your data. In this article, we’ll discuss how to visualize Microsoft Excel data and the different types of visualizations available.
What Is Data Visualization?
Data visualization is the process of transforming raw data into a graphical representation. This graphical representation can be used to better understand the data and uncover insights. Data visualization can be used to identify trends, patterns, and relationships in data that may not be obvious when looking at the raw data. It can also be used to communicate complex information in a more easily digestible format.
Types of Data Visualizations
There are many different types of data visualizations that can be used to visualize Microsoft Excel data. Some of the most common types of data visualizations include:
- Bar Charts
- Line Charts
- Pie Charts
- Scatter Plots
- Heat Maps
- Bubble Charts
- Area Charts
- Gantt Charts
- Flow Charts
How to Visualize Microsoft Excel Data
Visualizing Microsoft Excel data is relatively straightforward. The first step is to open the data in Microsoft Excel. Once the data is open, select the data you want to visualize. You can select the entire data set or just a subset of the data. Once the data is selected, you can choose the type of visualization you want to create. Microsoft Excel has a variety of built-in visualization options, including bar charts, line charts, pie charts, scatter plots, heat maps, bubble charts, area charts, Gantt charts, and flow charts.
Once you’ve selected the type of visualization you want to create, you can customize the visualization to better suit your needs. You can customize the colors, labels, and other aspects of the visualization to make it easier to understand. You can also add additional data points or remove data points to make the visualization more accurate. Once you’ve created the visualization, you can save it as an image file or embed it in a document or presentation.
Benefits of Visualizing Microsoft Excel Data
Visualizing Microsoft Excel data can provide a number of benefits. It can help you better understand the data and uncover insights that may not be obvious when looking at the raw data. It can also help you communicate complex information in a more easily digestible format. Visualizing data can also help you identify trends, patterns, and relationships in the data that may not be obvious when looking at the raw data.
Conclusion
Visualizing Microsoft Excel data can be a powerful tool for understanding and communicating complex information. It can help you identify trends, patterns, and relationships in the data that may not be obvious when looking at the raw data. There are many different types of data visualizations available, including bar charts, line charts, pie charts, scatter plots, heat maps, bubble charts, area charts, Gantt charts, and flow charts. Visualizing data can help you better understand the data and uncover insights that may not be obvious when looking at the raw data.


