How To Present Survey Results
Presenting survey results can be a daunting task, especially when you’re dealing with a large amount of data. But with the right approach, you can make the process easier and more effective. In this article, we’ll provide you with some tips on how to present survey results to small and medium-sized businesses, marketing agencies, market research firms, organizations with 51 to 1,000 employees, marketers, qualitative researchers, customer experience managers, market researchers, product researchers, SEO specialists, business analysts, data scientists, academic researchers and business owners.
Understand Your Audience
Before you start presenting survey results, it’s important to understand your audience. Who are you presenting to? What do they need to know? What are their goals? Once you have a good understanding of your audience, you can tailor your presentation to meet their needs.
Organize Your Data
Organizing your data is key to presenting survey results. You want to make sure the data is organized in a way that’s easy to understand. You can organize your data by demographics, by responses, by questions, or any other way that makes sense for your presentation.
Choose the Right Visuals
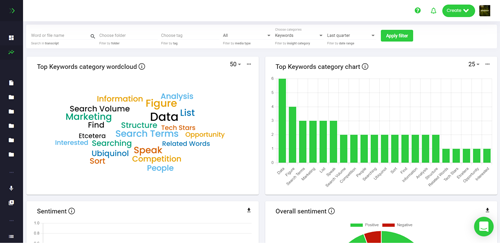
Visuals are an important part of presenting survey results. They can help make your data easier to understand and more engaging. When choosing visuals, make sure to pick ones that are easy to read and understand. You can use charts, graphs, tables, or other visuals to help illustrate your data.
Tell a Story
When presenting survey results, it’s important to tell a story. You want to make sure your audience understands the data and can draw their own conclusions. To do this, you can use storytelling techniques such as using visuals to illustrate a point, using analogies to explain a concept, or using quotes from survey respondents to emphasize a point.
Highlight the Key Takeaways
When presenting survey results, it’s important to highlight the key takeaways. These are the main points that you want your audience to remember. You can do this by summarizing the data, highlighting the most important points, or using visuals to emphasize a point.
Be Prepared for Questions
When presenting survey results, it’s important to be prepared for questions. Your audience may have questions about the data or the methodology you used. Make sure you’re prepared to answer any questions that may come up.
Be Clear and Concise
When presenting survey results, it’s important to be clear and concise. You want to make sure your audience understands the data and can draw their own conclusions. To do this, you should avoid using jargon and technical language, and focus on providing clear, concise explanations of the data.
Conclusion
Presenting survey results can be a daunting task, but with the right approach, it can be made easier and more effective. By understanding your audience, organizing your data, choosing the right visuals, telling a story, highlighting the key takeaways, and being prepared for questions, you can ensure that your presentation is successful. With these tips, you’ll be able to present survey results in a way that’s engaging and informative.


