How To Present Qualitative Data
Presenting qualitative data is an important part of any research project. It is essential to be able to effectively communicate the results of your research to stakeholders, customers, and other interested parties. Whether you are a marketer, customer experience manager, market researcher, product researcher, SEO specialist, business analyst, data scientist, academic researcher, or business owner, understanding how to present qualitative data is key to success.
Qualitative data is information that is collected through methods such as interviews, focus groups, and surveys. It is often used to gain a deeper understanding of a particular topic or issue. Qualitative data can be used to identify trends, uncover insights, and inform decision-making. However, it can be difficult to effectively communicate the results of qualitative research to others.
Tips for Presenting Qualitative Data
When presenting qualitative data, it is important to keep the following tips in mind:
- Organize the data: Before presenting the data, it is important to organize it in a way that is easy to understand. This can be done by grouping the data into categories or themes.
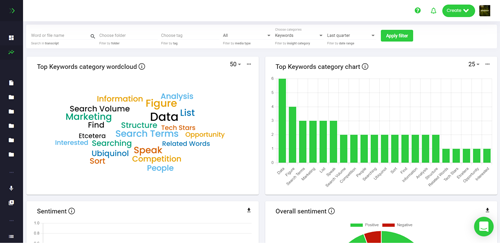
- Use visuals: Visuals can be a great way to communicate qualitative data. Using charts, graphs, and other visuals can help to make the data more accessible and easier to understand.
- Tell a story: Qualitative data can be used to tell a story. By presenting the data in a narrative form, it can be easier to understand and more engaging for the audience.
- Highlight key findings: When presenting qualitative data, it is important to highlight the key findings. This will help to ensure that the audience is able to understand the most important aspects of the data.
- Be prepared to answer questions: When presenting qualitative data, it is important to be prepared to answer questions. This will help to ensure that the audience is able to understand the data and its implications.
Best Practices for Presenting Qualitative Data
When presenting qualitative data, it is important to follow best practices. This will help to ensure that the data is presented in an effective and engaging manner. Here are some best practices to keep in mind:
- Keep it simple: When presenting qualitative data, it is important to keep it simple. Avoid using technical jargon and complicated visuals. Instead, focus on presenting the data in a way that is easy to understand.
- Be concise: When presenting qualitative data, it is important to be concise. Avoid presenting too much data at once, as this can be overwhelming for the audience.
- Focus on the key points: When presenting qualitative data, it is important to focus on the key points. This will help to ensure that the audience is able to understand the most important aspects of the data.
- Be engaging: When presenting qualitative data, it is important to be engaging. Use visuals, stories, and other techniques to make the presentation more interesting and engaging for the audience.
- Be prepared: When presenting qualitative data, it is important to be prepared. Make sure to practice the presentation beforehand and be prepared to answer any questions that the audience may have.
Conclusion
Presenting qualitative data is an important part of any research project. It is essential to be able to effectively communicate the results of your research to stakeholders, customers, and other interested parties. By following the tips and best practices outlined above, you can ensure that your qualitative data is presented in an effective and engaging manner.


