How To Analyze Survey Data In Python
Surveys are a powerful tool for gaining customer feedback, understanding customer preferences, and uncovering user pain points. But once you’ve collected the data, how do you make sense of it? That’s where Python comes in. Python is a powerful language for analyzing data, and it's quickly becoming one of the most popular tools in the data science toolkit. In this article, we’ll explore how you can use Python to analyze survey data and gain valuable insights.
Step 1: Clean Your Data
Before you can start analyzing your survey data, you need to make sure the data you’re working with is clean and organized. This means removing any blank responses, duplicate responses, and outliers. You should also make sure your data is organized and labeled correctly so that it’s easy to work with. To do this, you can use Python’s built-in data cleaning tools such as Pandas, NumPy, and SciPy.
Step 2: Visualize Your Data
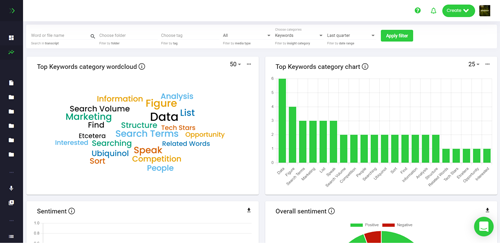
Once your data is clean and organized, it’s time to start visualizing it. Visualizing the data allows you to quickly identify trends and correlations that can help you gain insight into your survey data. Python has a variety of powerful visualization libraries such as Matplotlib and Seaborn that make it easy to create charts and graphs.
Step 3: Perform Statistical Analysis
Once you’ve visualized your data, you can start digging deeper by performing statistical analysis. Python has a variety of powerful statistical libraries such as SciPy and Statsmodels that make it easy to perform calculations such as mean, median, standard deviation, and correlation. This will allow you to get a better understanding of the data and uncover insights you may have missed.
Step 4: Use Machine Learning Techniques
Once you’ve done some basic statistical analysis, you can start using machine learning techniques to gain deeper insights. Python has a variety of powerful machine learning libraries such as scikit-learn and TensorFlow that make it easy to create and train machine learning models. You can use these models to uncover hidden patterns in your survey data and identify segments of users with similar preferences.
Conclusion
Analyzing survey data can be a daunting task. But with the power of Python, you can quickly and easily gain valuable insights from your survey data. Using the steps outlined in this article, you can clean and organize your data, visualize it to identify trends, perform statistical analysis to uncover insights, and use machine learning techniques to uncover hidden patterns. With the help of Python, you can turn your survey data into actionable insights that can help you make better decisions.
References
- Dataquest: Python Data Cleaning Tutorial
- Matplotlib: Python Plotting
- Seaborn: Statistical Data Visualization


